Github conveniently renders geojson and topojson files on the fly. This is useful for passing around geographic data and getting a quick look at what is in a file. They also implement the simplestyle-spec, which allows geojson data to contain information about how it should be rendered.
This is useful for distinguishing between different types of points (parks vs airports), but since they allow for any arbitrary fill color, it also opens up more interesting possibilities. Choloropleths, a type of thematic map, are one of those possibilities that help to better understand data trends in geographic data.
Using the geocolor module, geo data can be classified and themed easily to create these types of maps. The resulting geojson can then be added to a github repo or a gist and shared in an interactive format, something that would normally require GIS software or a custom web app (using something like d3 or leaflet).
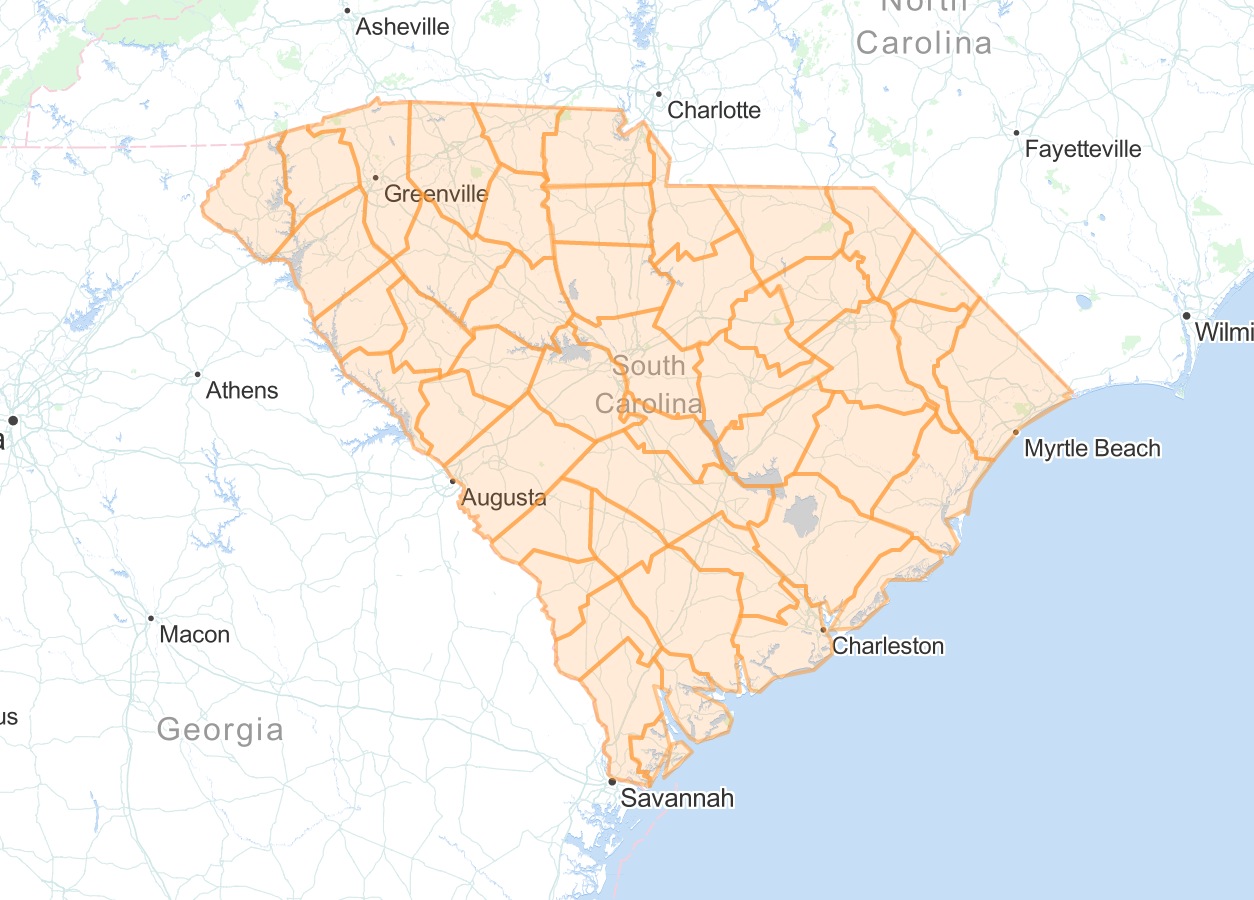
Let's look at an example. In this case we have a set of counties in South Carolina, each with a poverty index.
First we install geocolor:
npm install geocolor
Then we can use it in javascript. In this case we will classify the data using quantiles (although we can choose from several other options) and set the color ramp from blue to red. Any number of colors can be included in the color ramp (I recommend colorbrewer if you are looking for good ideas).
Here is what the code should look like:
var fs = require('fs'),
    geocolor = require('geocolor')

var geo = JSON.parse(fs.readFileSync(__dirname+'/in/sc_pov.geojson'))

geo = geocolor(geo, 'poverty', 'quantile', 7, ['blue', 'red'])

fs.writeFileSync(__dirname+'/out/sc_pov_choloropleth.geojson',
                  JSON.stringify(geo))
Now the results are in a file that we can upload to a gist or include in a gtihub repo.

2-7-14