Geocolor Improvements

I have made some signifagant improvements to geocolor over the last week. The api is more flexible now, and I have added support for random coloring as well as custom style options.
var geocolor = require('geocolor')

var cities = {
  // geojson goes here
}

var colors = ['green', 'red']

var style = {
  'stroke': 'white',
  'fill-opacity': .4
}

geo = geocolor.random(cities, colors, style)
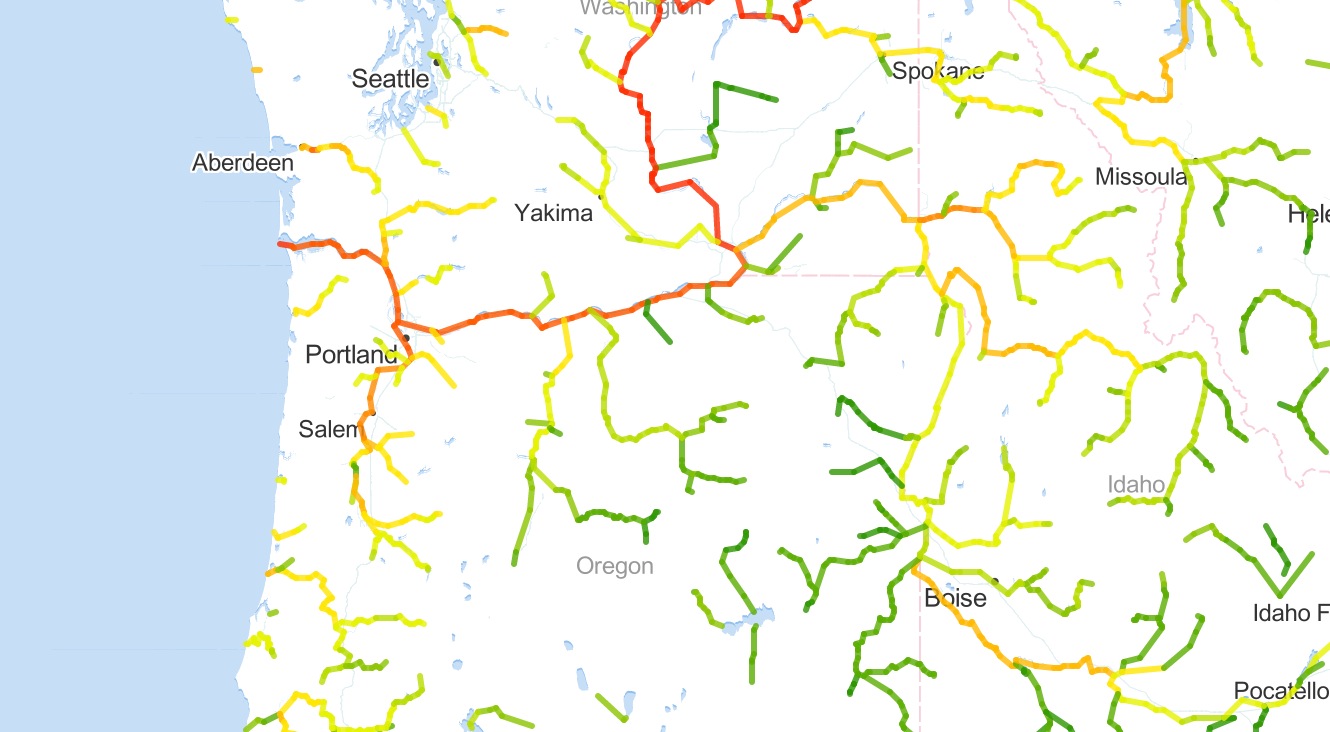
I have noticed that geojson performance in the browser (specifically github preview) takes a serious hit after ~500KB. Surprisingly, however, I have been able to share usable geojson all the way past 1MB. With proper simplification, this can represent a good bit of data. Below is a shot of west coast rivers colored by volume.

Although geocolor is basically "feature complete" now, my next step is to explore more efficient rendering tools. Mike Bostock's bl.ocks.org seems like a pretty good solution, and combined with a cli scaffolding tool, it could be a good way to pass geo visualizations around with larger amounts of data.
 [South Carolina Counties colored from green to red by population]
3-6-14