geotype continued
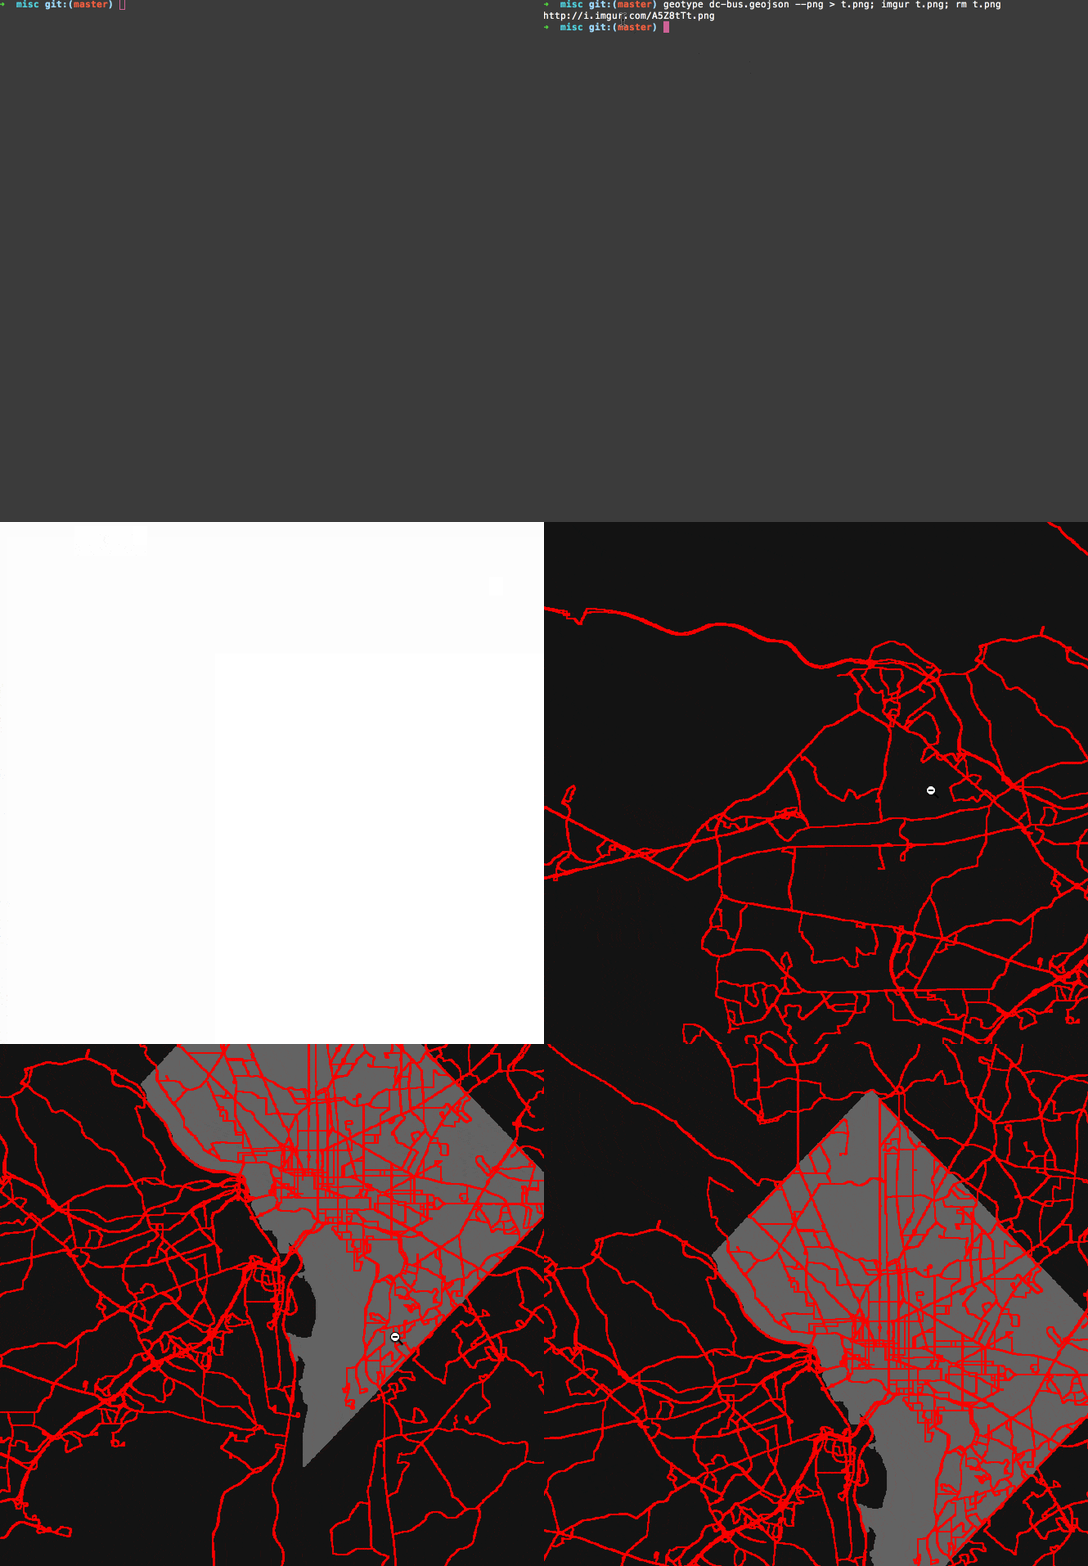
geotype now supports pipes and png image output. You can now think of geotype as an absurd mapnik parody from an alternate dimension.
Because geotype pipes png data, we can send the result straight to the imgur api and get a link back. Since we are not printing out characters to the terminal, we can set the resolution much higher (displaying characters in the terminal is a lot slower than displaying pixels in an image renderer).

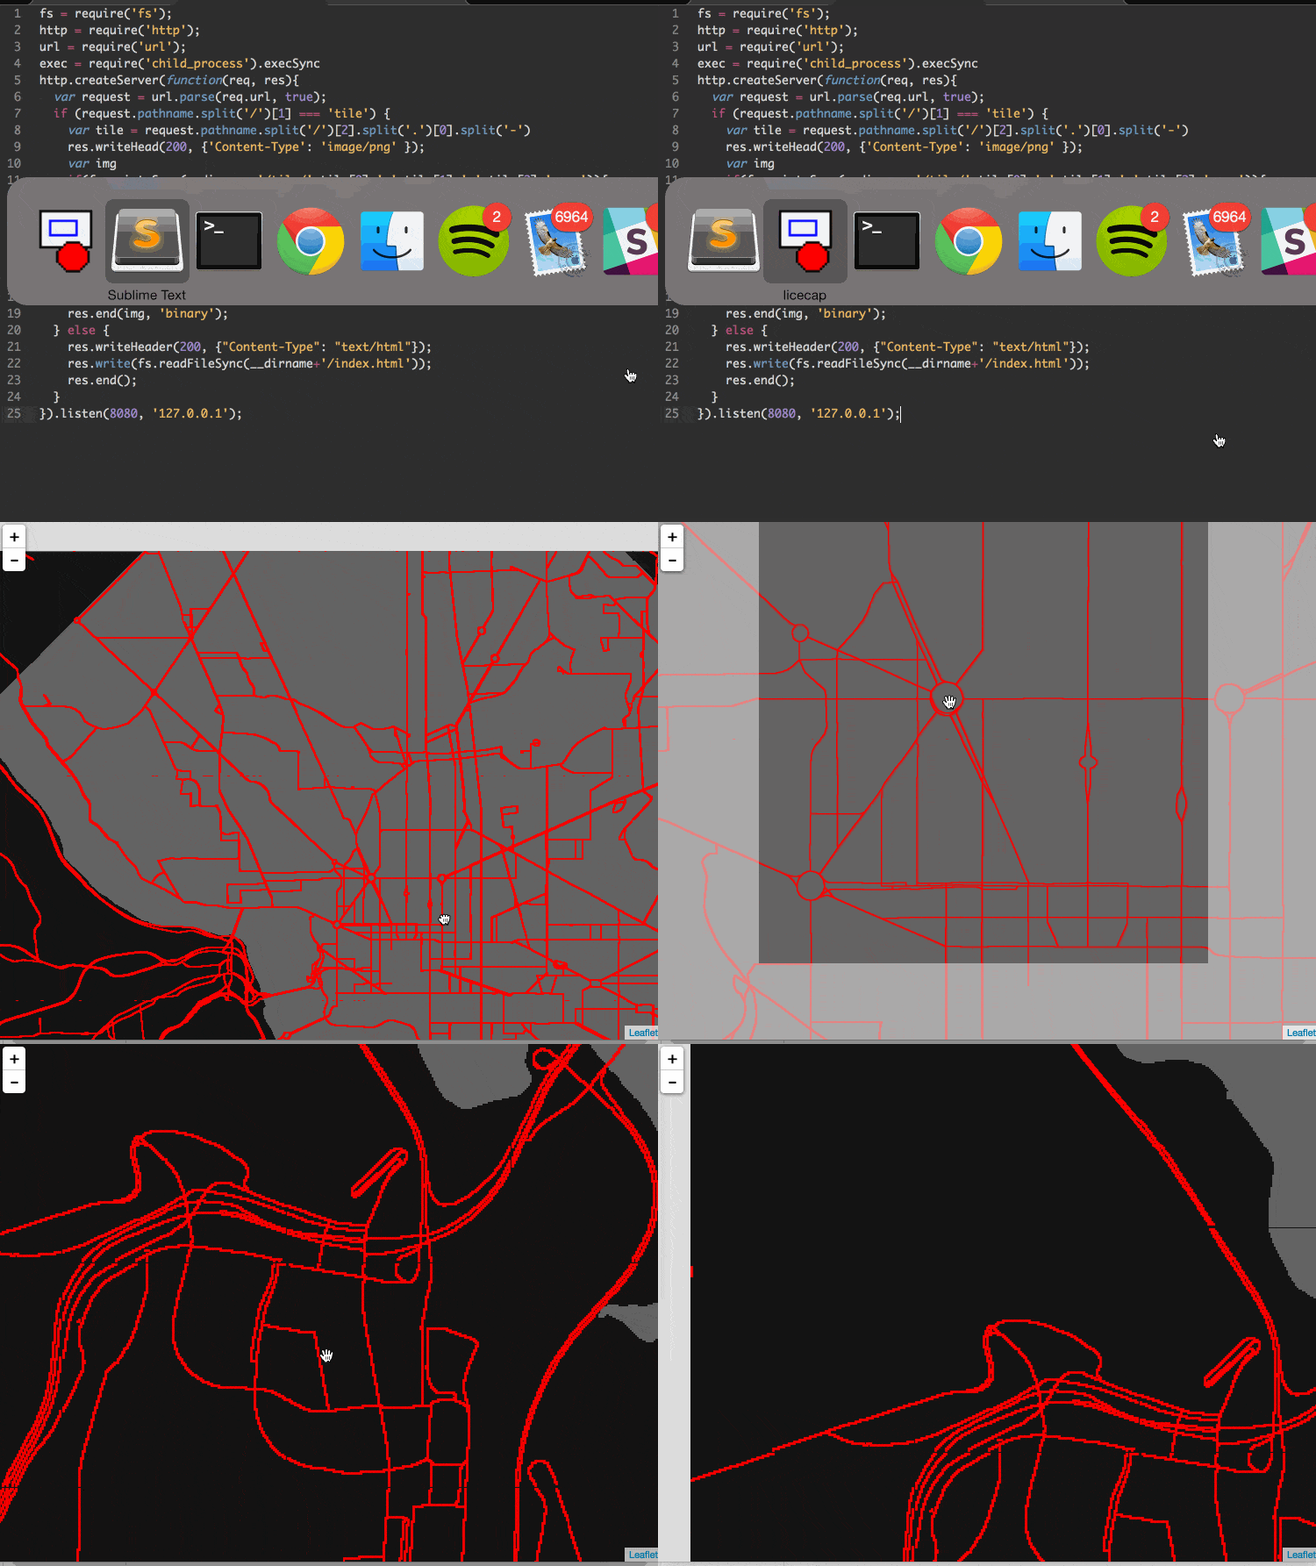
In just 25 lines of Javascript, we can even create a caching map server that integrates with Leaflet and generates tiles on the fly. Here's the DC bus system viewed in Leaflet:

Depending on how you configure geotype, tiles will dynamically render in ~.5-1 second each. This is pretty slow, but a simple script using tile-cover can be used to pre-cache all the tiles you need, so moving around the map will be lightning fast. A script to do this would look something like this:
var exec = require('child_process').execSync
var cover = require('tile-cover').tiles
var dc = require('dc.json')

var zoom = 16
var tiles = cover(dc, {min_zoom: zoom, max_zoom: zoom})
tiles.forEach(function(tile){
  var img = exec('geotype ./dc.json -p -f 0 -m 2 -t '+
    tile[0]+'/'+tile[1]+'/'+zoom)
  fs.writeFileSync(__dirname+'/tiles/'+
    tile[0]+'-'+tile[1]+'-'+tile[2]+'.png',img)
})
Pipe these images to a static server like s3 and you have yourself a very minimal map tile server (and I mean minimal!).
question round up
ok, so really.. why?
I built geotype 1 part as a fun hack and 1 part looking for a quick way to visualize test results. While working on Turf and various other geographic algorithm libraries, I find myself opening up GeoJSON data in QGIS or geojson.io hundreds of times a day. I wanted a way to speed up this feedback loop.
geotype for testing?
I see this working in two ways:
geotype as a quick repl renderer. You have a script and you want to see the results quickly on the fly.
A fuzzy diff tester. Geographic algorithms are notoriously difficult to test in a way that is not absurdly brittle. Using something like geotype, you might be able to save states of algorithmic output that can be compared against in the future. Facebook has experimented with comparing images for UI testing using Huxley; I think it could be reasonable to test changes in geography algorithms using a similar methodology. Tolerance control in testing is important, because having all your tests fail with unimportant changes leads to a "boy who cried wolf" view of tests. The opposite, "everything broke and it threw an error" is not sufficient for maintaining low level geographic systems.
what is tile-cover?
tile-cover is the geospatial indexer that powers the Mapbox geocoder, Carmen (carmen does a lot more than spatial indexing, but this is one key step). It is a pure JavaScript spatial indexer that can tell you which map tiles cover a geometry at a given zoom level range. This is important for looking up shapes fast in a database, and tile-cover is particularly suited for doing this across distributed systems. It steals a bunch of ideas from video games and old CRT displays so that it can be as fast or faster than comprable libraries written in C++.
what's next?
geotype currently displays characters with 4 styles. Each character is either styled as a point, a line, a polygon, or null data. It would be cool to also allow for additional styling using something like simplestyle-spec, which is supported by tools like geojson.io, Mapbox.js, and the Github map display.
3-26-15